Chicago sits in a position unlike almost any other metro area when it comes to school snow days. The city itself — run by Chicago Public Schools, one of the largest districts in the country — has a notoriously high tolerance for winter weather. The suburbs surrounding it close far more readily at lower thresholds. And Lake Michigan introduces a wildcard that no forecast captures reliably until the morning of a storm.
As the person who built and maintains the Snow Day Calculator at SnowDayCalculation.com, I have spent years studying how district closure decisions interact with weather data, reviewing real CPS announcements, and calibrating prediction models against what actually happened — not what forecasts said would happen. This guide is the product of that work: documented closure history from 2014 to 2025, observed thresholds for every district tier across Chicagoland, and an honest account of where our predictor is reliable and where it is not.
CPS vs. Suburban Districts: Two Very Different Thresholds
The most consequential thing to understand about Chicago-area snow days is that CPS and suburban districts do not share the same standard. A storm that is a non-event for CPS can close every school in Naperville. Using a generic "Chicago" input in any snow day calculator without knowing your district tier produces a misleading result.
| District Type | Observed Snow Threshold | Observed Wind Chill Threshold | Key Reason |
|---|---|---|---|
| Chicago Public Schools (CPS) | ~6–9 inches | ~Below −20°F | Priority arterial plowing; large city fleet |
| Near suburbs (Evanston, Oak Park, Cicero) | ~4–7 inches | ~Below −15°F | Mix of city-style and suburban roads |
| Mid suburbs (Naperville, Schaumburg, Arlington Heights) | ~4–6 inches | ~Below −15°F | Heavy bus reliance; secondary roads plowed later |
| Outer suburbs & exurbs (Joliet, Aurora, Elgin) | ~3–5 inches | ~Below −10°F | Rural road mix; last priority in county plowing |
| NW Indiana border (Hammond, Gary) | ~3–6 inches | ~Below −15°F | Indiana districts; strong southern lake-effect exposure |
Sources: Thresholds observed from reviewing closure announcements and local meteorological reporting across multiple Chicago winters (2014–2025), cross-referenced with NWS Chicago storm records. These represent observed patterns, not officially published district policy documents. Individual storms vary significantly based on road conditions, timing, and ice accumulation.
The practical translation: when our predictor shows 60% for a CPS ZIP code, the same storm conditions likely represent 75–85% probability for a mid-suburban ZIP. The model separates these tiers automatically — but only if you enter your specific ZIP. For a national perspective on how much variation exists between states, our guide on how much snow cancels school covers thresholds across the full US.
CPS Closure Decision Process in Detail
Chicago Public Schools does not close based on a single weather number. The decision involves the CEO's office, CPS Transportation, and the Chicago Department of Streets and Sanitation working in parallel through the early morning hours. Here is how those factors interact:
Real-time road assessment by CPS Transportation
CPS runs one of the largest school transportation systems in Illinois. On storm mornings, transportation supervisors physically drive their assigned zones before the closure call is made — typically before 5 AM — and report conditions directly to district leadership. This field check can override any forecast. A storm that underperforms its prediction can keep schools open; one that surprises to the upside can close them even when a probability model showed a modest chance.
Streets and Sanitation response capacity
Chicago's Department of Streets and Sanitation prioritises Lake Shore Drive, major arterials, and bus routes first. On a typical overnight storm, these corridors are treated and partially cleared before 6 AM. This is why CPS regularly stays open when suburbs close — the roads its buses use are serviced earlier. You can find information about Chicago's winter road operations through the City of Chicago's winter operations page. Suburban secondary roads get attention later, sometimes after buses are already supposed to be running.
Forecast confidence and worst-case spread
When there is meaningful probability of a significantly worse outcome than the median forecast — say, a notable chance of 8 inches when the most likely outcome is 4 — CPS may close preemptively. Our predictor reflects this through its confidence badge: a wide forecast spread produces a "low confidence" flag and pulls the probability estimate toward 50% to reflect genuine uncertainty. For more on how prediction accuracy compares across tools, see our most accurate snow day calculator comparison.
Wind chill and cold-only closures
CPS has closed for extreme cold with zero snowfall on four documented occasions since 2014 (see the history table below). When wind chills fall to dangerous levels, the risk of frostbite at exposed bus stops and walking routes becomes the primary concern — not road conditions. According to NWS frostbite safety guidelines, exposed skin can develop frostbite in 30 minutes or less at wind chills of −20°F and below. The January 2019 closures, the most extreme in modern CPS history, were entirely cold-driven.
The Closure Morning: Hour-by-Hour Timeline
Understanding when the decision happens — and who is doing what — makes our probability scores more interpretable. Here is how a typical CPS closure morning unfolds based on observed patterns:
Best time to check our predictor. Evening forecast model runs incorporate the latest data. This is the most reliable prediction window — more accurate than afternoon outlooks, earlier than morning-of conditions. For lake-effect events especially, do not rely on forecasts from before 8 PM. Check NWS Chicago for any lake-effect snow watches or warnings that have been issued.
Streets & Sanitation overnight push. City salt trucks and plows begin their arterial and bus-route passes. CPS Transportation monitors road treatment progress. This is the window that determines whether the arterial network will be passable by 6 AM.
CPS Transportation field checks. Zone supervisors physically drive assigned areas and report conditions — accumulated depth, ice, visibility — to district leadership. This is the single most influential data point in the decision. No public tool has access to these reports.
Decision made by CPS leadership. The CEO's office reviews transportation reports, NWS Chicago forecasts, and Streets & Sanitation updates. Decision is finalized. Suburban districts make their calls in roughly the same window, often slightly earlier for severe events.
Official announcements go out. cps.edu updates, automated phone and email alerts to families, local TV crawls (WGN, ABC 7, NBC 5), and social media posts. If you have not received notice by 6:15 AM, school is almost certainly open.
Chicago's Wind Chill Problem
Lake Michigan's wind exposure combined with flat prairie geography means Chicago wind chills regularly plunge far below the air temperature. In January and February, air temperatures in the single digits combined with dangerously low wind chills is not unusual — and that combination alone, with no snow at all, can close schools across the entire metro.
The NWS wind chill chart and CDC cold stress guidelines both note that wind chill is the operative danger at bus stops and walking routes — not just air temperature. Chicago's documented closure history reflects this directly.
−10°F to −15°F: CPS monitors closely; outer suburban districts may close.
−15°F to −20°F: Most suburban districts have closed or delayed; CPS evaluates formally.
Below −20°F: CPS closure becomes probable — consistent with the 2018 and 2024 documented closures.
Below −30°F: Near-certain closure across all Chicagoland districts based on observed history.
Below −45°F: Historic threshold — January 2019 polar vortex; two-day closure.
Our predictor applies stronger wind chill weighting for Chicago-area ZIP codes than for most other regions. A −15°F wind chill in Chicago triggers a significantly higher probability score than the same reading in cities without Chicago's documented history of cold-only closures. The coefficients are calibrated against the real events in the history table below, not against a national default.
Lake-Effect Snow and Why It Makes Chicago Forecasts Harder
NOAA explains that lake-effect snow forms when cold air passes over a warmer Great Lake, picking up moisture and depositing intense, localized snowfall on the downwind shore. Unlike synoptic storms that models can track for days, lake-effect bands can intensify within hours and drop several inches on a narrow corridor while areas 10 miles inland see almost nothing. This is the primary reason our predictor's confidence badge drops for certain Chicago events — not a weakness in the model, but an honest reflection of what the underlying meteorology allows.
The NWS Chicago office (call sign LOT) issues lake-effect snow advisories and warnings specifically for Lake Michigan-affected zones. Checking for an active lake-effect snow warning in your county zone is the single best bedtime indicator for North Shore and South Shore residents.
The North Shore ZIP codes — Evanston (60201), Wilmette (60091), Winnetka (60093), and Lake Forest (60045) — are most exposed under northwest winds, the dominant winter pattern. South Shore communities including Chicago Heights (60411) and Park Forest (60466) take harder hits when wind tracks from the southwest. These geographic patterns are consistent with NWS Chicago's lake-effect snow warning zones.
When you see a "low confidence" badge on our predictor for a Chicago-area ZIP, lake-effect uncertainty is almost always the reason. In these situations, the 10–11 PM check is more reliable than any afternoon forecast, and checking for an active NWS lake-effect warning before bed is essential. For a broader look at how prediction tools handle this kind of uncertainty, see our review of the Fox 8 snow day calculator.
Which Chicago ZIP Codes Get More Snow Days?
Not all Chicago-area ZIP codes are equal when it comes to school closure frequency. Two factors drive the difference: the district's observed threshold (lower = more closures) and lake-effect exposure. Here is a practical breakdown by tier, based on observed patterns across multiple winters:
South Shore (Prairie-Hills D144 area): 60411, 60466, 60438
Frequency patterns based on observed closure announcements 2014–2025, cross-referenced with NWS Chicago storm archives. "Closure events" includes full closures and 2-hour delays. Individual seasons vary significantly based on storm patterns.
Documented CPS Closure History (2014–2025)
Below is a documented record of notable CPS weather closures over a decade, compiled from CPS official announcements, Chicago Tribune and Chicago Sun-Times reporting, WGN meteorological archives, and National Weather Service Chicago archived storm records. This covers full-closure events and significant multi-day events — it is not exhaustive of every delay or early dismissal, and snow totals represent metro-wide ranges observed across multiple reporting stations rather than single-point measurements.
| Date(s) | Cause | Reported Conditions | CPS Decision | Suburban Impact |
|---|---|---|---|---|
| Jan 6–7, 2014 | Cold only | Air temperature approximately −16°F; wind chills reported near −40°F across the metro by NWS Chicago | 2-day closure | Near-universal metro closure |
| Feb 1–2, 2015 | Snow + cold | 8–10 inches reported across the metro; wind chills in the −20°F to −30°F range | 2-day closure | Most suburban districts closed both days |
| Jan 23, 2016 | Snow | 8–12 inches; blizzard-level wind conditions | Full closure | Widespread; some districts closed Jan 22 preemptively |
| Dec 11, 2016 | Snow | 6–8 inches; significant ice accumulation on untreated surfaces | Full closure | Most Cook County districts closed |
| Jan 12, 2018 | Cold only | Air approximately −4°F; wind chills in the −20°F to −26°F range per NWS Chicago | Full closure | Most districts closed or delayed |
| Jan 29–30, 2019 | Cold only — Polar Vortex | Air approximately −21°F citywide; wind chills falling below −45°F in many areas per NWS Chicago records | 2-day closure — most extreme documented modern event | Universal closure across the entire metro |
| Feb 12, 2019 | Snow | 7–10 inches from a mid-February synoptic system | Full closure | Most suburban districts closed |
| Jan 28, 2021 | Snow + cold | 7–9 inches; wind chills in the −10°F to −20°F range | Remote learning day (pandemic-era protocols in effect) | Mixed — many districts were in hybrid or fully remote at the time |
| Feb 2, 2023 | Snow + lake-effect | 8–11 inches metro-wide; strong NW winds; NWS Chicago reported North Shore lake-effect totals reaching 11+ inches while inland areas received significantly less | Full closure | Near-universal; North Shore districts among the hardest hit |
| Jan 15, 2024 | Cold only | Air approximately −10°F; wind chills in the −25°F to −35°F range per NWS Chicago | Full closure | Most Cook and collar county districts closed |
| Feb 5, 2025 | Snow + cold | 6–8 inches; wind chills in the −15°F to −22°F range; South Shore lake-effect enhancement reported | Full closure | Widespread; South Chicago and Indiana border districts among the hardest hit |
Sources: CPS official announcements, Chicago Tribune, Chicago Sun-Times, WGN meteorological reports, NWS Chicago (LOT) archived storm records. January 2021 is an indication of pandemic period remote learning, not a regular closure. Snowfall amounts are citywide range data from various NWS reporting sites. Cold data are NWS reported data. Last updated against available records: July 2026.
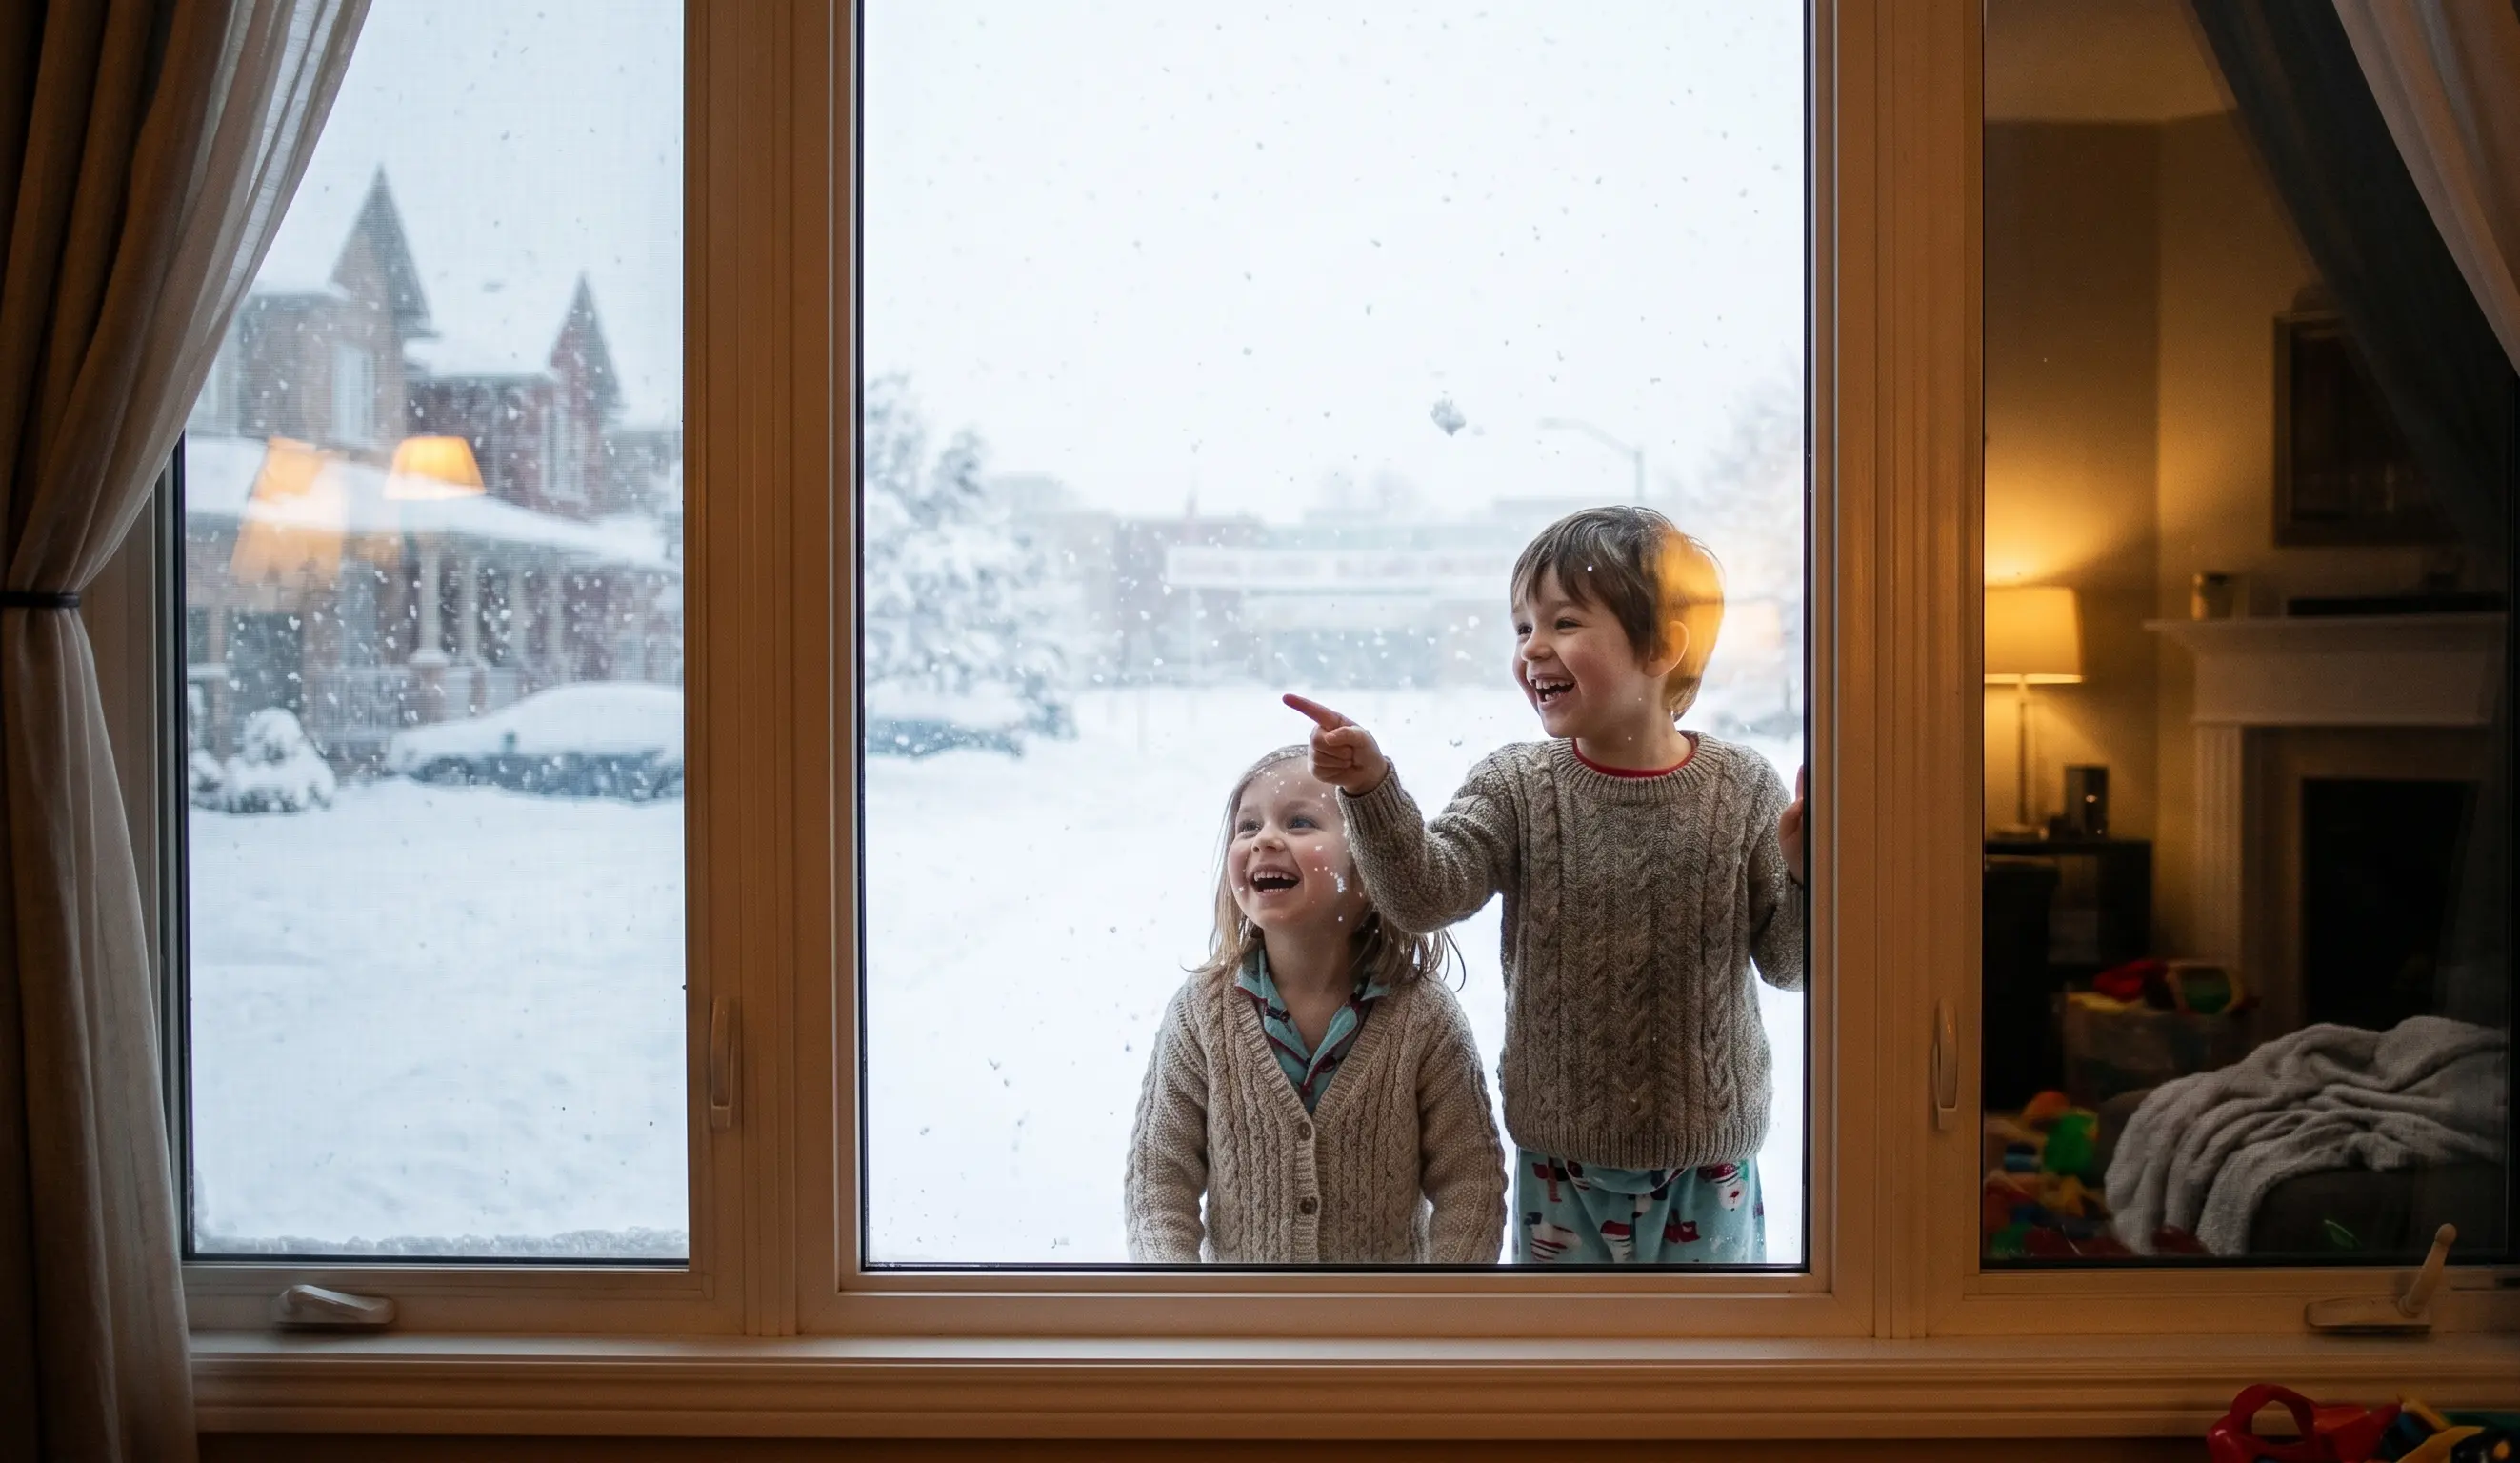
CPS buses travel a mix of aggressively plowed arterials and lower-priority residential streets. The closure decision is driven by residential zone conditions reported by supervisors before 5 AM — not by arterial conditions visible to most commuters.
What the Closure Record Actually Shows
Three patterns emerge clearly from eleven years of documented CPS closures.
First, cold alone closes CPS — no snow required. Four of the eleven events above (2014, 2018, 2019, 2024) were cold-only closures. Wind chill falling below roughly −20°F appears to be CPS's observed cold threshold based on these events. According to NWS frostbite safety guidance and CDC cold stress documentation, those wind chills create genuine health risk at exposed bus stops within 30 minutes — which is why frostbite risk at walking routes and bus stops, not road conditions, was the stated concern in each case. Any snow day calculator that underweights wind chill for Chicago will produce systematically low estimates in these situations.
Second, the 6-inch threshold is an approximate floor, not a guarantee. CPS stayed open through several storms with similar totals in this same period that did not make this table. Road treatment capacity and storm timing matter as much as the accumulation total. A well-treated arterial network can keep a 6-inch storm manageable; an untreated one cannot.
Third, lake-effect events produce localized impacts that national forecast tools often underestimate. The February 2023 event produced significantly more snow on the North Shore than inland areas from the same storm. A single citywide "Chicago" forecast misses this entirely — which is why the confidence badge in our predictor drops for lake-effect setups and why you need to enter your specific ZIP.
Over the 2014–2025 period documented here, CPS closed for weather approximately 2 to 4 times per season on average, with significant year-to-year variation. The 2018–19 winter produced 3 closures in one season. Suburban Cook County districts typically see more weather events per season when delays are included, primarily because of lower district thresholds — not because they receive more total snowfall.
How to Use Our Predictor for Chicago
Here is how to read our snow day predictor accurately for the Chicago metro — not how it works in general, but specifically what to do for this region:
- Always enter a ZIP code, not just "Chicago." The model applies five different district-sensitivity profiles. 60637 (Hyde Park, CPS) and 60540 (Naperville) return meaningfully different numbers for the same storm. The city average obscures the difference that matters most.
- The 10 PM reading is the one to trust. Evening model runs have incorporated the latest lake temperature and boundary-layer data. Afternoon forecasts for overnight storms are substantially less reliable — especially for lake-effect events.
- Read confidence alongside probability. 72% with high confidence means a likely closure. 65% with low confidence means genuinely uncertain. The confidence badge tells you how much to trust the number, not just what the number is.
- Watch the wind chill tile, not just the snow total. A forecasted wind chill of −18°F pushes the Chicago probability score upward even with modest projected snowfall. Most generic calculators underweight this for Chicago specifically.
- Check storm timing, not just 24-hour accumulation. Snow peaking at 6 AM is weighted 1.8× more than the same snow peaking at noon in our model — because CPS road assessments happen before 5:30 AM.
Want a probability calibrated to your specific Chicago ZIP code for tonight's storm?
Check Your Chicago ZIP Code →How Our Chicago Prediction Model Works
What the model cannot do: Access real-time CPS Transportation field reports, live plow tracking, superintendent communications, or the specific condition of any residential bus-stop street. These are the inputs that determine the actual decision, and none of them are publicly available. The model's probability is an estimate — a directional one for weather-driven closures, and explicitly uncertain when human decisions diverge from weather patterns.
The Chicago model's specific inputs and coefficients:
- Forecast data: Live hourly forecast from Open-Meteo. Variables include hourly snowfall, snow depth, wind speed, wind gust, 2m air temperature, apparent temperature (wind chill equivalent), and precipitation phase.
- District sensitivity tiers: Five tiers (CPS, near suburbs, mid suburbs, outer suburbs, Indiana border). Each has separate weighting coefficients for snow depth, wind chill, and morning precipitation timing — calibrated against the documented closure history above.
- Morning precipitation weight: Precipitation in the 5–8 AM window is weighted 1.8× versus afternoon precipitation. CPS road assessments conclude before 5:30 AM — snow peaking later is less likely to trigger closure even with equivalent totals.
- Forecast spread penalty: When ensemble spread exceeds a threshold, the confidence score drops and the probability estimate is pulled toward 50%. This produces "low confidence" badges — most common on lake-effect events where NWS Chicago itself often cannot pin down band placement until a few hours before.
- Wind chill multiplier: Chicago ZIP codes receive an above-national-average wind chill sensitivity coefficient, calibrated against the four documented cold-only closure events (2014, 2018, 2019, 2024) and cross-referenced with NWS wind chill danger thresholds.
Full technical details are on our data sources page and weather APIs page. External weather science references: NOAA, NWS Chicago, NCAR weather prediction research.
A Note from the Site's Developer
I built and maintain the Snow Day Calculator at SnowDayCalculation.com, and I have been tracking Chicago-area closure patterns since 2018. That context informs everything in this guide — the thresholds, the tier structure, the wind chill coefficients. They come from reviewing what actually happened in official CPS announcements and NWS Chicago storm records, not from assumptions about what should happen.
The honest limitation of any prediction tool, including ours, is that the most consequential information in a CPS closure decision is made at 4 AM and is not publicly available. Transportation supervisors physically drive bus zones. Road crew supervisors call in conditions from specific corridors. The superintendent weighs a forecast that may have shifted at 2 AM. None of that reaches a model.
What a good model can do is give you a well-calibrated directional read the night before — better than a gut feeling, better than a generic national calculator, but always understood as a probability estimate rather than a decision. The practical playbook below is how I actually use this tool myself on storm nights.
You can review my technical work at my portfolio or connect via LinkedIn.
The Practical Playbook: Chicago Edition
The most reliable approach layers three checks rather than relying on any single number or tool:
☑ Night-Before Chicago Snow Day Checklist
- 8–10 PM — Check our predictor with your actual ZIP code. Use the number as a directional read. Note whether the confidence badge is high or low — low confidence on a Chicago winter night almost always means lake-effect uncertainty.
- Bedtime — Check NWS Chicago for active warnings. Look specifically for freezing rain advisories, wind chill warnings, or lake-effect snow warnings for your county zone. Ice and extreme cold are the variables our model handles but generic calculators often miss. Wind chill watches and warnings use the same danger thresholds documented on the NWS wind chill chart.
- Bedtime — Note the storm's end time. Snow ending before 5 AM gives Streets & Sanitation a full working window. Snow still falling at 6 AM does not, even at lower totals — this single variable shifts outcomes more than most parents expect.
- If you are in a suburban ZIP: Our predictor already applies lower thresholds for suburban tiers. Trust that the model is using your district's observed threshold, not CPS's. The same storm really does hit differently for different districts.
- If the forecast is borderline (3–5 inches) and temperatures are near freezing: A two-hour delay is often the most likely real outcome — not a full closure or a normal day. Most calculators do not model delays; treat a middling probability (35–55%) on a borderline night as a delay signal.
- 5:00–5:30 AM — Check cps.edu or your district's official channels. WGN-TV, ABC 7, and NBC 5 Chicago carry school closings live. This is the only source with access to real-time road condition reports from the people who actually inspected the roads. Individual suburban district websites — such as Naperville CUSD 203, Elgin U-46, or Evanston/Skokie D65 — post closures directly as well.
Frequently Asked Questions
How much snow does it take to cancel Chicago Public Schools?
Based on documented closure announcements from 2014–2025, CPS has typically required approximately 6 to 9 inches combined with hazardous road conditions — though the transportation supervisor field assessment matters as much as the total. Chicago's Streets and Sanitation aggressively clears arterials and bus routes overnight, letting CPS stay open in conditions that close most suburbs. Wind chill below roughly −20°F can close CPS with no snowfall at all, documented in January 2014, January 2018, January 2019, and January 2024. For how these patterns compare nationally, see our state-by-state snow cancellation guide.
Do Chicago suburbs cancel school more easily than CPS?
Yes, based on observed patterns. Near suburbs like Evanston and Oak Park have typically closed at 4–7 inches. Mid-suburbs like Naperville and Schaumburg have closed at 4–6 inches. Outer suburbs have closed at 3–4 inches. The gap is road priority — suburban secondary roads are plowed later than Chicago arterials, making bus routes more hazardous in the same storm.
What is the best snow day predictor for Chicago?
Our Snow Day Predictor uses live Open-Meteo data with five district-specific sensitivity tiers for the full Chicago metro. Enter your ZIP code — not just "Chicago, IL" — for a result that reflects your district's observed threshold. For comparisons with other tools, see our accuracy roundup and the Fox 8 snow day calculator review.
Does lake-effect snow affect Chicago school closures?
Yes, particularly for North Shore districts and South Chicagoland communities. NOAA documents that lake-effect bands can drop substantial snow in a narrow corridor while areas 10 miles away see almost nothing. NWS Chicago issues lake-effect snow advisories and warnings for affected county zones — checking for an active warning the night before a storm is the most reliable step for North Shore and South Shore residents. These events are inherently harder to forecast, which is why our confidence badge drops for lake-effect setups.
What time does CPS announce school closures?
CPS typically announces between 4:30 AM and 6:00 AM via cps.edu, the CPS app, WGN-TV, ABC 7, and NBC 5 Chicago, plus automated phone and email to registered families. Suburban districts announce in roughly the same window, sometimes as early as 4 AM for severe events. Any prediction made the night before is an estimate — the decision-makers have not yet inspected the roads.
Has CPS ever closed school for cold alone, with no snow?
Yes, four times in the documented record: January 6–7, 2014, January 12, 2018, January 29–30, 2019 (the most extreme modern event with wind chills reported well below −40°F), and January 15, 2024. In each case, frostbite risk at bus stops and walking routes was the stated concern, not road conditions. The CDC cold stress guidelines document that exposed skin can develop frostbite in 30 minutes or less at wind chills below −20°F.
Which Chicago ZIP codes get the most snow days?
North Shore ZIPs — 60201 (Evanston), 60091, 60093, 60045 — and South Shore suburban ZIPs tend to see more closure events due to documented lake-effect exposure. Outer suburban codes like 60432 (Joliet) and 60506 (Aurora) also see more closures than CPS city ZIPs due to lower district thresholds. CPS city ZIPs close less often than most suburban codes despite being geographically closer to the lake.
How is the Chicago predictor different from a general snow day calculator?
A generic calculator uses national averages. Our Chicago model applies five district-sensitivity tiers, weights morning precipitation 1.8× versus afternoon, and uses wind chill coefficients calibrated against documented cold-only CPS closure events. It also integrates NWS Chicago forecast data rather than national model output, and applies lake-effect confidence penalties for exposed North Shore and South Shore ZIP codes. The result reflects how this specific metro actually behaves.
Final Verdict
The deeper point is that no calculator — including ours — has access to what actually determines a CPS closure: the transportation supervisor's early morning field report, the Streets & Sanitation status on residential bus corridors, or the superintendent's judgment on a forecast that may have shifted at 2 AM. Those inputs never reach a public algorithm.
Use our predictor with your specific ZIP to set expectations the evening before. Check wind chill and look for active warnings at NWS Chicago at bedtime. Then confirm with cps.edu or your district's official channels by 5:30 AM. That three-step approach beats any single tool, every time.
Will Chicago Schools Close Tomorrow?
Enter your ZIP code for a real-time probability calibrated to your specific district — CPS and all suburban tiers modeled separately.
❄️ Check Your Chicago ZIP Code →